
Sports are more than just competition.
Professional sports play an integral role in shaping cultural identities, fostering community, and driving significant economic activity nationally and internationally. Beyond entertainment, sports leagues reflect societal values, often exposing deeply rooted disparities in representation, opportunities, and compensation. Our project investigates how revenue and compensation in the WNBA compare to major male professional sports leagues and showcases key data points that help explain why these differences exist. The data, sourced from Kaggle.com, provides detailed revenue and salary information for the WNBA and other major male sports leagues, enabling a direct comparison of financial disparities. To deepen our analysis, we also draw on research like “Wage Dispersion and Sports Performance: Does Gender Matter?” by Margarita Arutiunova and Thadeu Gasparetto, which examines how wage inequality impacts team performance and highlights the broader implications of inequitable compensation structures. This combination of datasets and scholarly insights allows us to explore not only the extent of these financial gaps but also the underlying societal and structural factors that perpetuate them, making this topic both relevant and timely in ongoing conversations about equity in professional sports.
The issue of gender-based pay disparities in professional sports has been a significant focus of academic and public discourse. Scholars have examined how factors such as revenue generation, media representation, and societal biases contribute to these inequalities. The idea of revenue generation is seen as a key concept that plays a big role in the gender pay gap in these professional leagues. However, many claim that even if media coverage was equal between the women and men’s sports, that there would still be a difference due to the discrepancy not being a result from merely engagement and viewership, but from ingrained gender norms. Furthermore, media representation is not solely dependent on the amount of coverage that leagues are receiving, but also the biases and societal attitudes that are still very much apparent today. The way social media has changed the visibility and marketability of women’s sports is one idea that has not been thoroughly examined, despite the fact that these ideas have been explored in various ways. Although the marginalization of women’s sports by traditional media used to be much more prominent, the development of streaming services and digital platforms have given players and leagues the ability to engage with their viewers and to overcome the barriers that mainstream media held on societal attitudes. These opportunities have allowed for women to emerge from the shadows and expectations of society, allowing them to shape their own identities, expanding both professionally and financially. Ultimately making us question how these shifts and incoming shifts in societal attitudes will affect revenue and the pay gap between women’s sports and other leagues in the future.
In a time where women’s sports are gaining new viewership, fandom, and popularity across a multitude of leagues and levels, it is important to contextualize both how far women’s sports have come, and how much there is to go compared to their male counterparts. On platforms like Twitter, it was found that there has been an increase in communication and posting about the WNBA since games have been broadcast on national TV. This finding shows that the increase in engagement and popularity of the WNBA is influenced by how accessible it is to watch. As discussed in the dataset, a percentage increase in revenue from TV viewership for the league gets funneled back to the players both helping the popularity and the salary imbalance between the WNBA and men’s professional leagues. Thus lies this project’s importance. While this project focuses specifically on inequalities and trends in sports between men and women, the results found are not dissimilar to that of other parts of the workforce and society, more generally. The WNBA’s average player salary is around $75,000, while the NBA’s average player salary is $7.7 million. That means that the average WNBA player is making 0.97% of what the average NBA player earns. For context, as of 2023, the U.S. Department of Labor estimated that the average woman made 84% of what the average man earned. Even though these are two very different numbers, it shows that there is pay inequality in multiple other sections of the workforce.
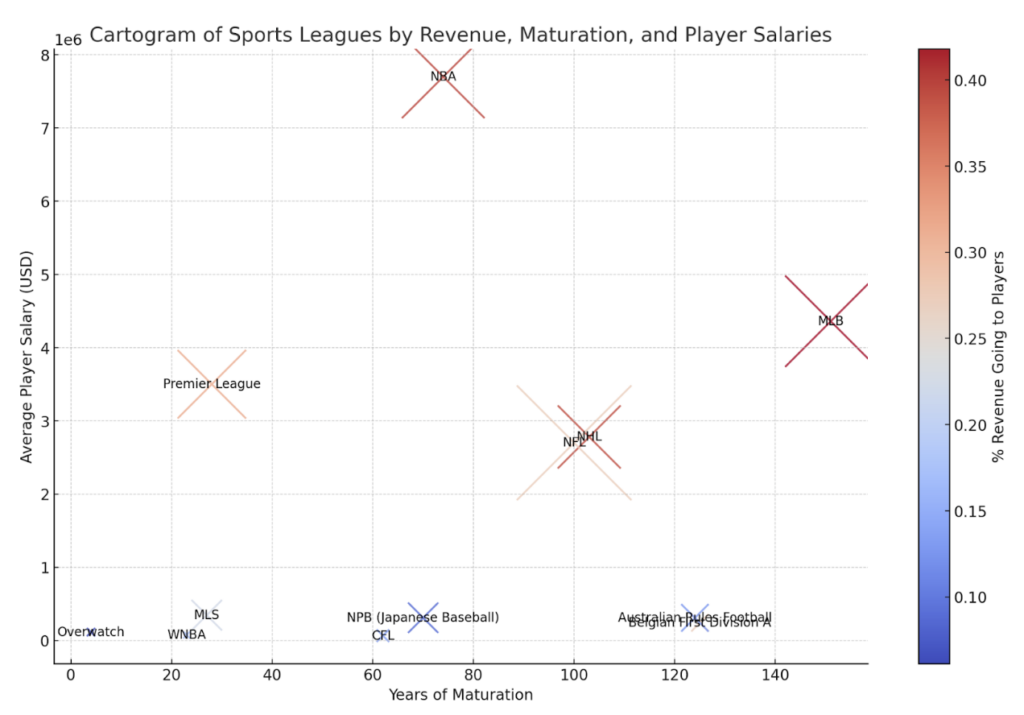
Cartogram of Sports Leagues by Revenue, Maturation, and Player Salaries
The cartogram map showcasing leagues by revenue, maturation, and player salaries reveals significant disparities in player compensation and revenue allocation across professional sports leagues. Leagues like the NBA and MLB, which have been established for decades or over a century, dominate in both total annual revenue and average player salaries, as shown by the large and high-positioned bubbles. Conversely, leagues like the WNBA, despite still being nearly three decades old, allocate a smaller percentage of their revenue to players, reflecting broader systemic inequities. The color gradient reinforces this observation, showing that even leagues with lower revenues may not prioritize equitable compensation structures. Socially, the map reflects how economic power is concentrated in male-dominated sports leagues, a trend driven by historical investment and cultural perceptions. These disparities are significant to this project as they highlight the need for a more equitable distribution of resources and opportunities across professional sports, particularly for women’s leagues like the WNBA.
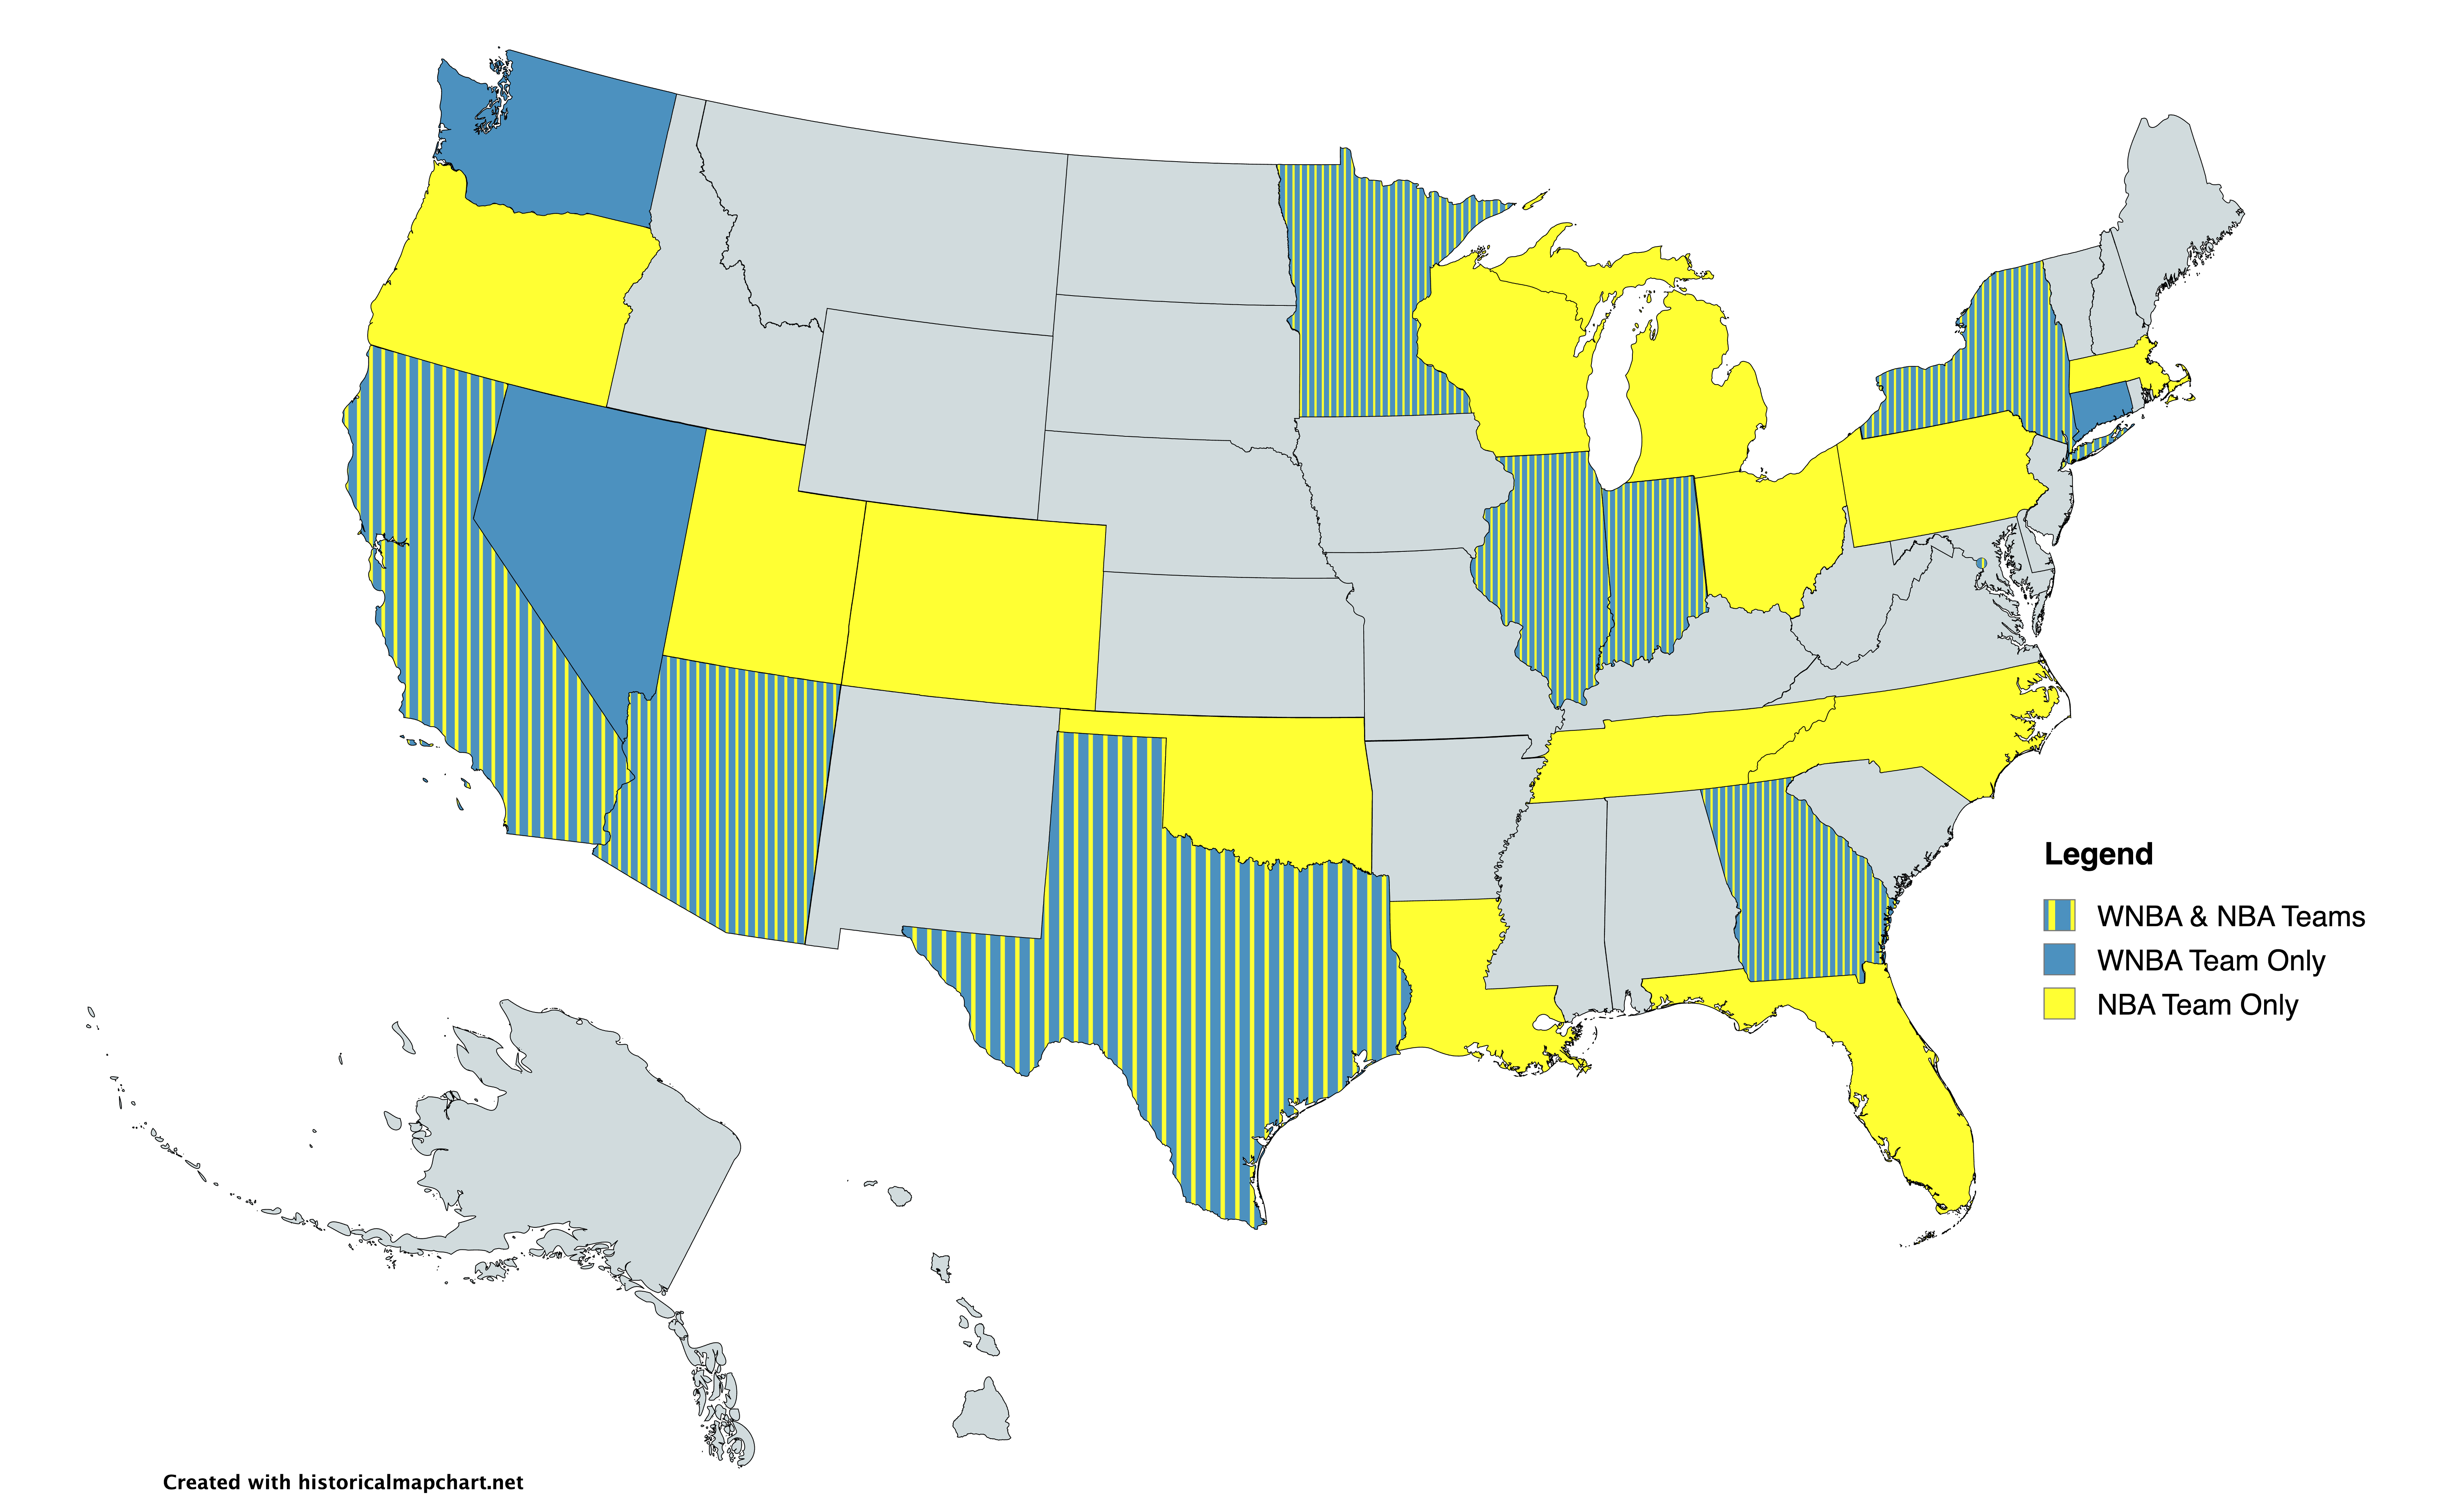
Map of the United States Displaying States With/Without NBA/WNBA Teams
This map was created using Historical Map Chart. We used the data list from 1 Key Data (https://state.1keydata.com/nba-teams-by-state.php) and ESPN (https://www.espn.com/wnba/teams) to label the states and their teams correctly. This map relates to our dataset because it helps visualize a more specific topic within our research. The WNBA is the league we are using to compare revenue, salaries, etc. to other professional sports leagues around the world. This map compares the NBA and WNBA with how many teams there are and how they overlap with each other.
The first aspect one sees when looking at this map is that there are more overlapping states (NBA & WNBA teams) than states with exclusively a WNBA team (blue). To contextualize this map geographically, it is important to note that the “big markets” are all covered. California (Los Angeles), New York (New York City), and Illinois (Chicago) all have teams in both leagues. It will be interesting to compare revenue/salary differences between the two leagues with this map that shows there is no real difference geographically in outreach and marketability. While there are more NBA teams, the WNBA teams are all in the “big market” states besides Massachusetts (Boston) and Florida (Miami). Accessibility for fans should not be much of an argument as states with a team in both leagues usually share the same arena/stadium.
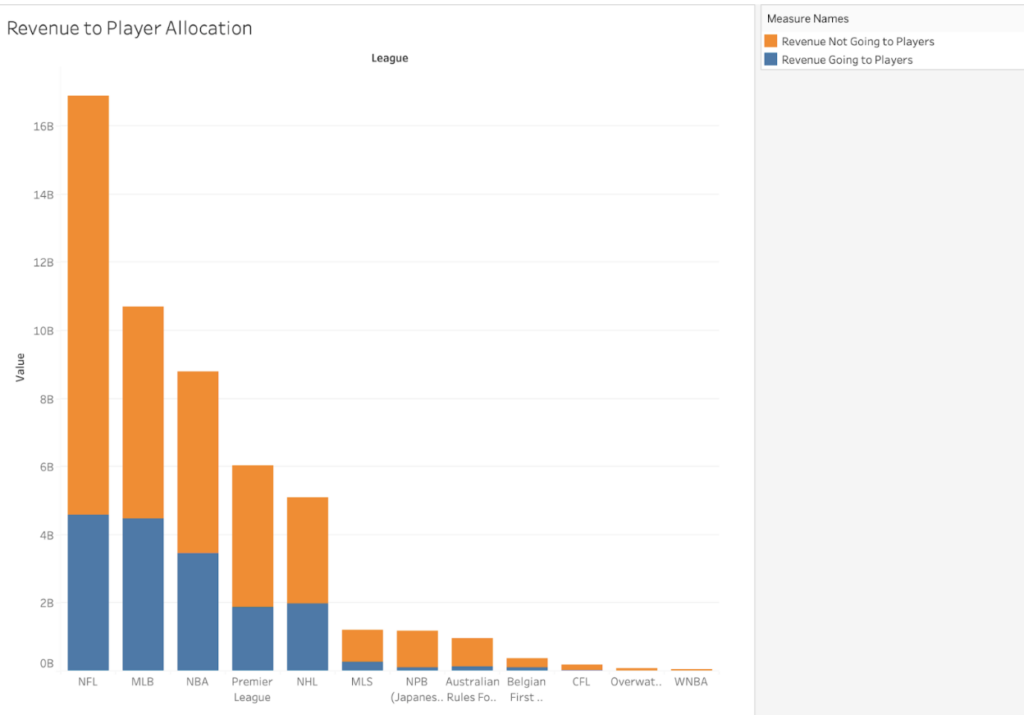
Allocation of Total Revenue Across Leagues
By stacking “Revenue Going to Players” and “Revenue Not Going to Players” within each bar, we can see both the absolute values and the relative proportion of revenue allocated to players in each league.stacked bar chart is ideal for visualizing both the total revenue for each league and the portion allocated to player salaries. The stacked bar chart reveals significant differences in how each league allocates its revenue to players. Leagues like the NBA, MLB, and NFL not only generate high total revenue but also allocate a substantial portion of that revenue to player salaries. For example, in the NFL, while the league generates the highest revenue overall, a notable portion is allocated to other expenses, with a relatively smaller proportion dedicated to players compared to the NBA. On the other hand, leagues like the WNBA and CFL have lower overall revenue, and the portion allocated to players is correspondingly smaller, resulting in lower player salaries.
This visualization provides a broader understanding of the financial structures of different leagues and how they impact player compensation. Leagues with higher revenue, such as the NBA and NFL, have the resources to invest heavily in player salaries, reflecting the value placed on player talent in revenue-sharing. However, in leagues like the WNBA, lower total revenue limits the funds available for player salaries, contributing to a significant pay gap compared to men’s leagues. This chart underscores the economic challenges faced by smaller leagues and highlights the relationship between revenue generation and player pay across professional sports.
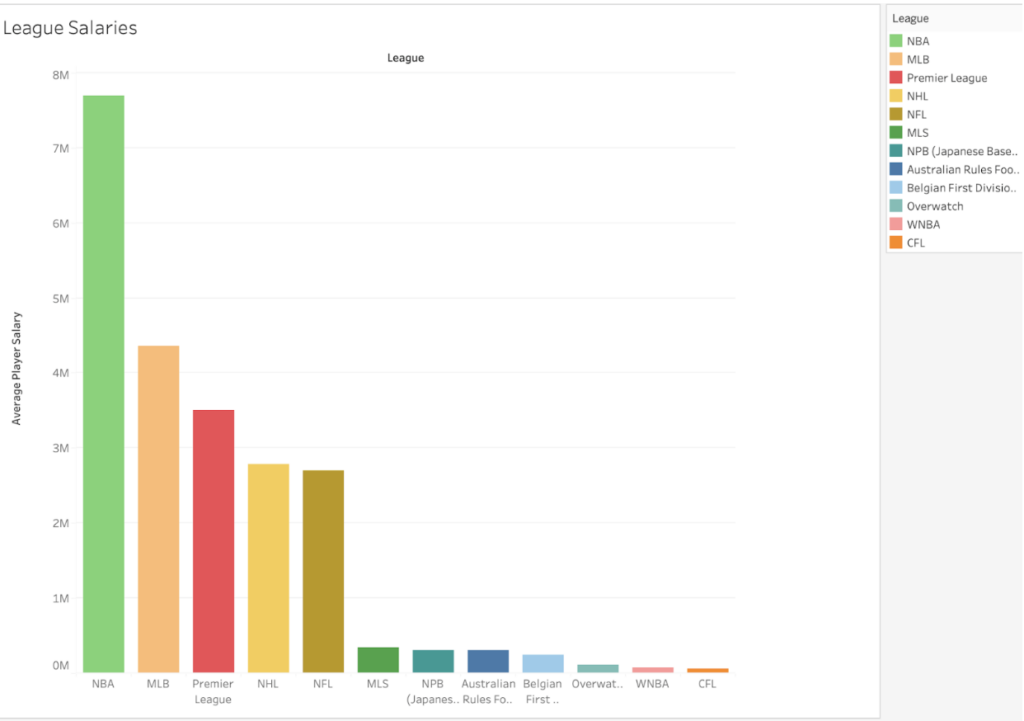
Average Salaries of Players Across Leagues
Taking a look at simply the League Salaries, the gender-based salary disparities in professional sports is apparent, specifically between the NBA and WNBA. As the NBA receives larger media coverage, starkly higher ticket sales, and substantial sponsorship deals, it generates more revenue, which then influences player salaries. On the other hand, the WNBA has faced immense challenges in revenue generation, media exposure, and investment, which greatly negatively impacts player compensation. As the NBA’s average player salary is around $7 million and the WNBA’s average player receives under $100,000, there is a clear need for discussions on how to better support women’s sports to narrow the salary gap between male and female athletes. It has long been argued that the WNBA’s lower compensation and media coverage in comparison to the NBA is attributable to its shorter history, but the visualization shows that a WNBA player receives less on average than an Overwatch player. Overwatch was designated as a sport in 2017, while the WNBA was founded in 1996, demonstrating that the pay gap reflects broader issues within the sports industry related to gender equity and the financial support given to women’s sports.
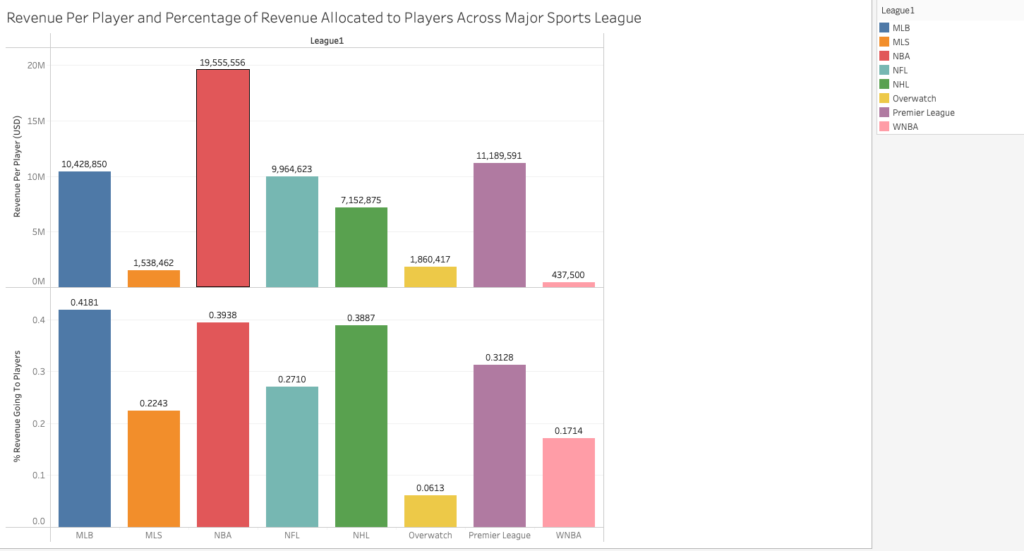
Revenue Per Player and Percentage of Revenue Allocated to Players Across Major Sports Leagues
The dual bar chart reveals stark contrasts in revenue distribution across leagues, with the NBA leading in revenue per player at $19.6 million, while the WNBA shows the lowest at $437,500 per player. The WNBA also allocates the second smallest percentage of revenue to players (17.1%), while MLB allocates the highest (41.8%). These disparities indicate a significant gap in compensation for athletes in female-dominated leagues compared to those in male-dominated leagues. This visualization emphasizes the structural inequalities in revenue generation and player compensation, with the WNBA lagging behind other leagues both in terms of revenue per player and revenue share. This reinforces the existence of systemic barriers to achieving financial parity in women’s sports.
When analyzing categorical data such as revenue per player and percentage of revenue allocated to players across various leagues, a dual bar chart is an effective choice. Bar charts allow for easy comparison between distinct categories, making it ideal for visualizing the financial landscape in different sports leagues. By using separate bars for revenue per player and percentage of revenue allocated to players, we can simultaneously observe both absolute and relative financial metrics. This chart type enables a clear visual comparison of disparities between leagues, especially in highlighting leagues where athletes receive a smaller share of revenue or lower earnings per player. Adding color for each league allows us to quickly identify and differentiate trends by league, making it easy to see where significant gaps lie in player compensation.
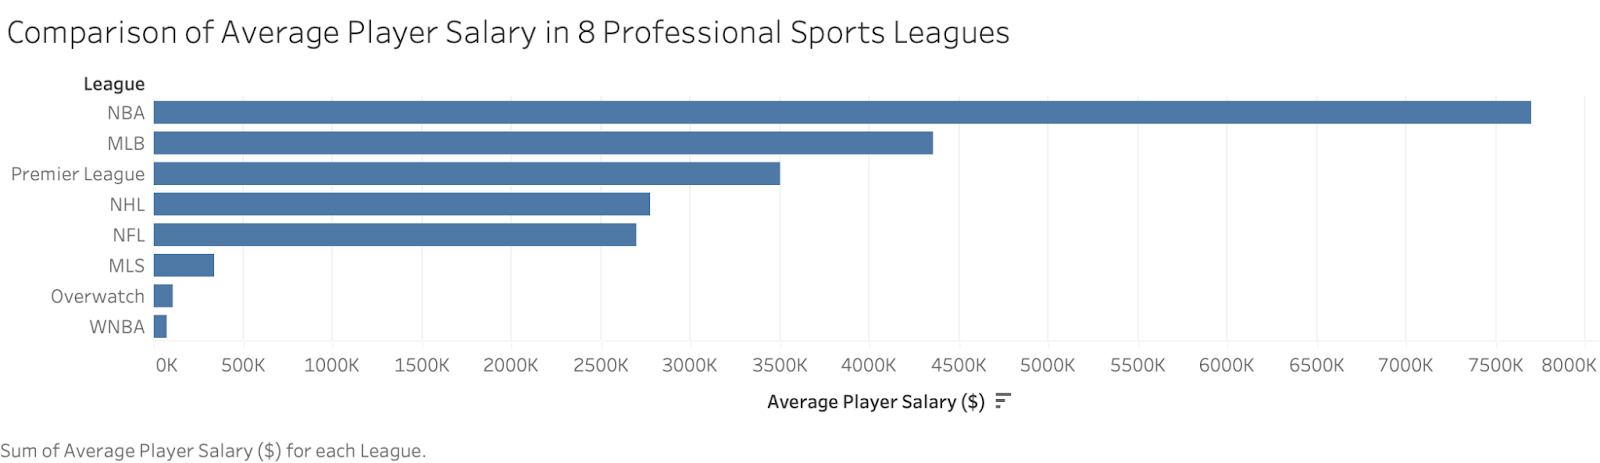
Figure 1: Bar chart comparing average player salary across the 8 sports leagues
The most surprising finding from this visualization of average player salary is that the Overwatch League has a higher average player salary ($114,000) than the WNBA ($75,000). The Overwatch League is an Esports competitive league while the WNBA is an athletic league. With the Overwatch League being the only league in this data set that is not a physical sport, and with how new its creation is, it is surprising that it is not last in this comparison. Even though women’s sports–more specifically women’s basketball– have become more popular over the past couple of years, it is clearly far behind in compensation for its players. Secondly, Even though the MLB is the only league with no salary cap, it is interesting to see that it does not have the highest average player salary. This leads to questions about the NBA and how it has enough money in order to pay the players this much (owners, bargaining agreement, etc.).
A bar chart was chosen for this data analysis because it is effective in comparing data categorically. This data visualization has the ability to isolate each league and display its respective average player salary for comparison. Ordering the data in order from highest to lowest average player salary helps the reader to understand the story that it is telling more clearly. The visualization reveals that the NBA has the highest average player salary at $7,700,000 and the WNBA has the least at $75,000.
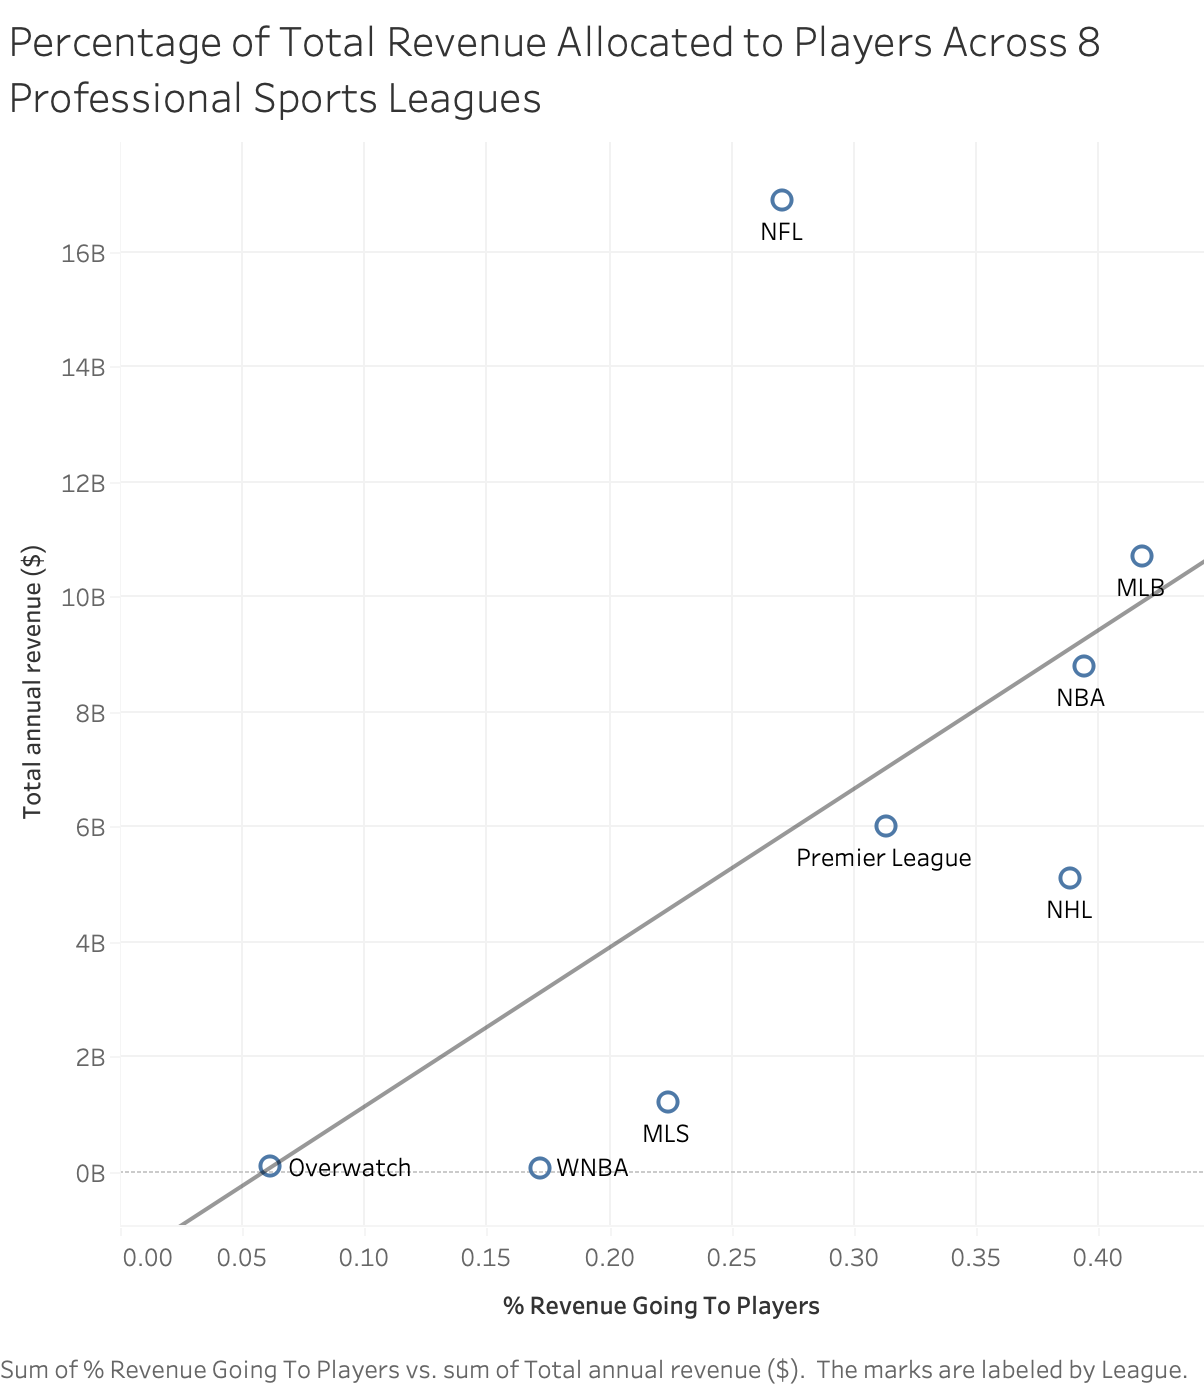
Figure 2: Scatter plot of Total Revenue and % Revenue Going to Players
The findings from this scatter plot reveal that the WNBA’s split of total revenue to its players is relatively beneficial for the athletes. While the league’s total revenue is around $63,000,000, its percentage given to players is around 17%. An interesting finding is that the NFL has 268.25 times the amount of revenue as the WNBA (16,900,000,000), but only a 10% increase in revenue given to players (27%). This makes the NFL the only clear outlier in this case. Secondly, this shows that the WNBA is one of the fairer leagues when it comes to revenue sharing with players. Another “fair” league for the players is the NHL which has the third-highest % of revenue given to players, but only the fifth-highest revenue overall. Tying in Figure 1, it is interesting to compare the relationship between average salary which is relatively low for the WNBA, and % of revenue given to players which is somewhat fair in comparison.
A scatter plot is an effective chart to display trends between two variables. This chart-type can reveal correlation through visual trends and patterns. Another benefit of using a scatter plot in this situation is that it clearly exposes outliers as well. If a data point does not follow the trend line, it is an outlier. The scatter plot reveals that there is a positive, roughly linear relationship between total league revenue and percentage of league revenue given to players. Overwatch had both the lowest revenue and lowest percentage given to players, while the MLB had the most. The NFL was an outlier with the most revenue, but only the 5th highest percentage given to players.
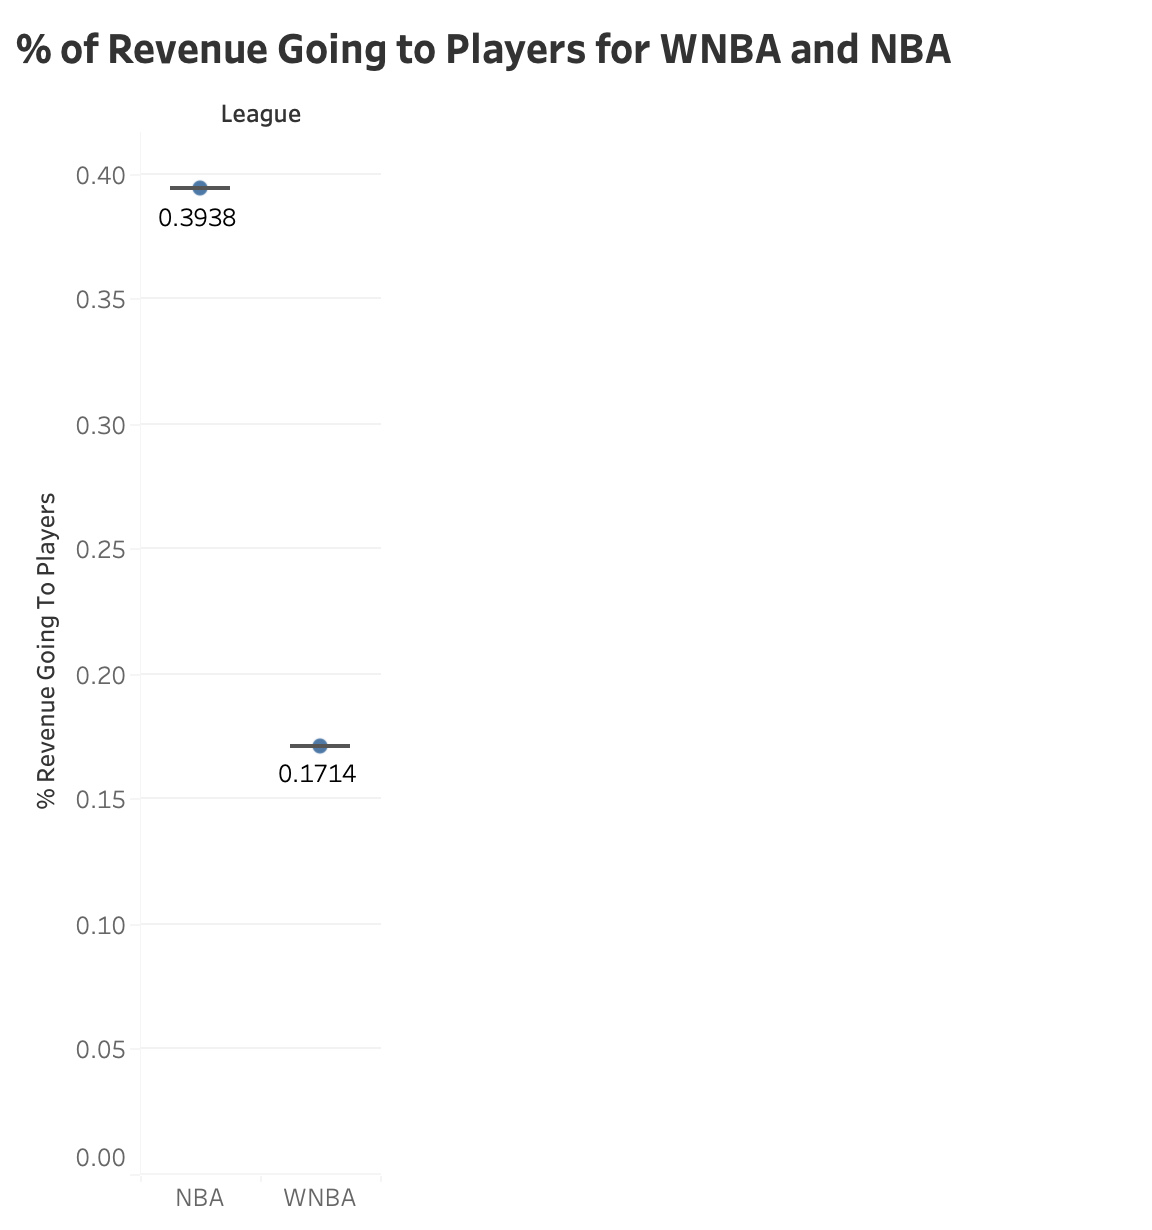
Percentage of Total Revenue Directly Given to Players in WNBA and NBA Leagues
This chart displays the percentage of revenue between both leagues: WNBA and NBA. The X-axis displays simply the league name, and the y-axis displays the percentage amount of money that players in both leagues approximately get from the league itself.
A player’s revenue income is a good reflection of the league because it reflects whether a league prioritizes its players over income, moreover how a leagues revenue is shared with athletes. When the revenue income of a league is large, then the salary for players in that respective league is usually higher. Through this, when a league is prioritizing its athletes and allocating them with higher revenues, it shows how a league is more invested in an athlete’s success. And due to this, leagues with this higher consistency are usually given more opportunities, and therefore have a higher chance at more opportunities to concentrate on their performance, training, and career longevity due to this financial security. Therefore, my claim is that leagues who invest more in their players have a higher chance of seeing them succeed. Due to the difference in popularity in WNBA and NBA, WNBA is more likely to have less investment and therefore less salary/revenue, this ultimately leading them to this contrast in success. Overall, this popularity goes deeper than just pure enjoyment, but it also speaks on other issues on how women athletes are perceived and on how discrimination against women in athletics has shaped the system of each league. It dived deeper than just the amount of fans a team has, but to systematic biases and gendered views on women in athleticism.